| About me & building map |
|---|
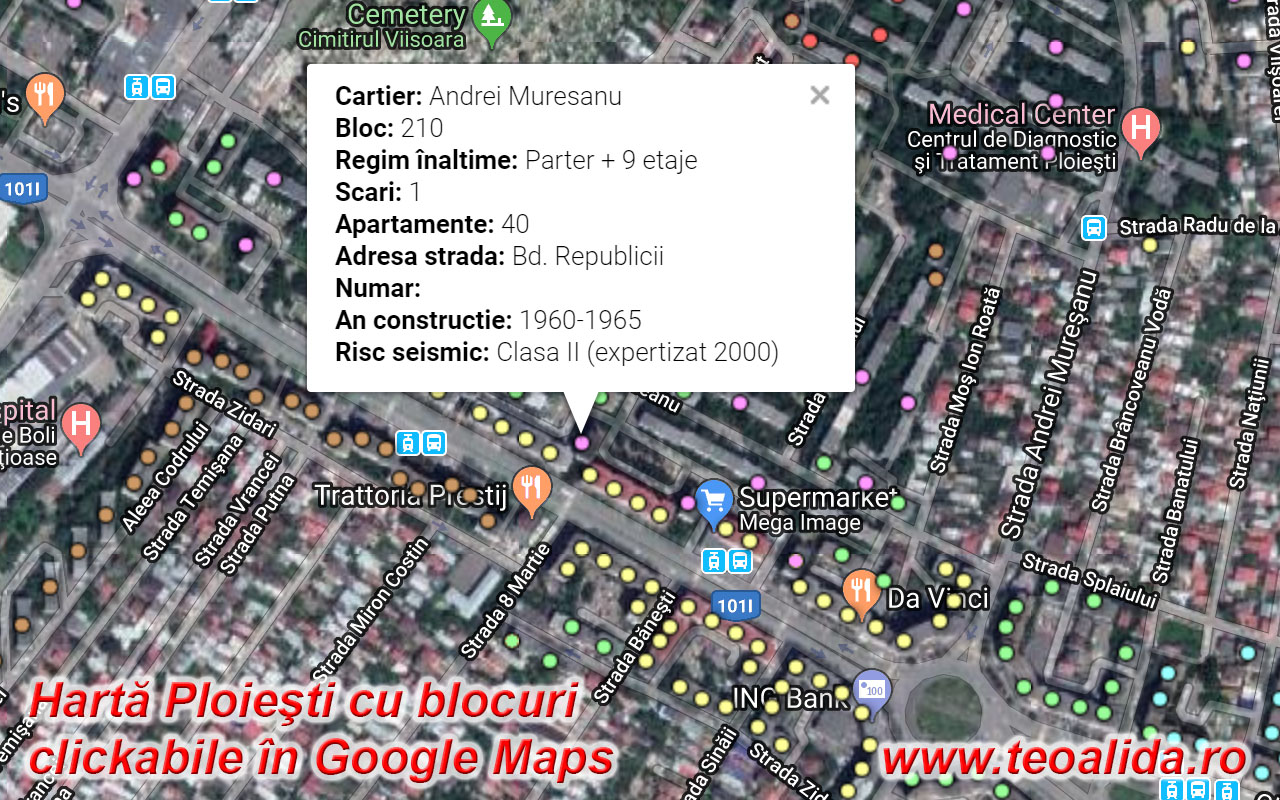
| HartaBlocuri.ro is a voluntary project „Made by Teoalida” and is NOT affiliated with any government authority or company. Data offered on this website represent 80% personal research (online and on street), 10% data offered by government), 10% data offered by contributors visiting website. The map is not 100% accurate, but you can contribute by telling me data for blocks where it is missing or wrong. I research communist real estate since 2005 and using satellite photos + Google Street View I can identify building models, estimate construction years and tell number of apartments including how many rooms in each. In 2018 I started compiling building info in Excel and display on this interactive map to share my experience with everyone. As September 2023 the database reached 40,000 buildings with 1,800,000 apartments (so in 5 years I centralized 40-45% of buildings and 50-55% of total apartments in Romania). Real estate agencies and other people needing bulk data can buy whole Excel database, can also buy floor plans (editable AutoCAD files) or make PayPal donations. But the money is not enough to employ other people, thus further development of this project depends by my free time and ability to find volunteers. |
| Culoare . . . . . . . | blocuri | scări | aparta mente | blocuri cu plan | blocuri cu nr ap | apart cu nr camere | camere cămin | 1 cameră | 2 camere | 3 camere | 4 camere | 5 camere | 6 camere |
|---|---|---|---|---|---|---|---|---|---|---|---|---|---|
| 4245 | 1648 | 17066 | 4.10% | 32.70% | 9.46% | 5.58% | 32.59% | 22.30% | 20.88% | 13.07% | 5.14% | 0.43% | |
| 1759 | 2995 | 27948 | 27.63% | 80.22% | 68.82% | 17.98% | 10.50% | 56.05% | 14.28% | 1.19% | |||
| 1273 | 2450 | 40658 | 42.42% | 94.11% | 69.92% | 3.48% | 8.52% | 61.55% | 25.75% | 0.69% | |||
| 1873 | 4723 | 96795 | 70.32% | 96.48% | 95.24% | 0.85% | 4.80% | 65.37% | 28.16% | 0.82% | |||
| 3435 | 7951 | 214458 | 81.95% | 98.72% | 97.44% | 10.92% | 13.07% | 49.81% | 21.85% | 4.35% | |||
| 3048 | 6419 | 170959 | 70.14% | 99.05% | 95.61% | 7.10% | 13.73% | 50.84% | 25.62% | 2.70% | 0.02% | ||
| 4067 | 9595 | 238682 | 81.66% | 99.24% | 98.22% | 8.33% | 6.88% | 53.43% | 27.38% | 3.97% | 0.01% | ||
| 3043 | 5996 | 202387 | 93.30% | 99.64% | 95.33% | 13.60% | 8.30% | 38.42% | 35.00% | 4.67% | 0.01% | ||
| 7475 | 14269 | 314102 | 92.94% | 99.20% | 96.51% | 0.06% | 17.25% | 44.37% | 31.32% | 6.98% | 0.02% | ||
| 11190 | 18262 | 351086 | 90.92% | 99.11% | 94.21% | 6.60% | 49.19% | 35.74% | 8.35% | 0.13% | |||
| 5984 | 9561 | 193716 | 80.70% | 96.96% | 86.21% | 18.90% | 29.31% | 40.08% | 11.53% | 0.18% | |||
| 483 | 753 | 17655 | 19.67% | 83.02% | 45.73% | 29.64% | 39.37% | 28.38% | 2.46% | 0.15% | |||
| 3882 | 4064 | 286590 | 0.46% | 38.69% | 13.01% | 22.98% | 48.11% | 22.58% | 5.25% | 0.79% | 0.29% | ||
| 770 | 73 | 0.13% | 0.00% | 0.00% | |||||||||
| Total | 52527 | 88759 | 2172102 | 68.00% | 86.62% | 82.30% | 4.80% | 11.63% | 47.14% | 30.57% | 5.78% | 0.07% | 0.01% |
Earthquake risk classes
In 1992 authorities made (fantasy) promises to retrofit all apartment blocks, according P100-92 normative.
Criteria was not only based on how solid were buildings, but also building importance, location, number of affected people, presence of ground floor shops, etc, and some owners were bribing engineers to classify building in ![]() category which (theoretically) were getting free retrofit in the next 2 years.
category which (theoretically) were getting free retrofit in the next 2 years. ![]() in 5 years and
in 5 years and ![]() in 10 years, while
in 10 years, while ![]() did not needed retrofit.
did not needed retrofit.
Over 1700 building were vague inspected in Bucharest and other hundreds/thousands nationwide, and assigned to these „urgency categories” from 1992 to 1996 when authorities stopped promising retrofit (source: acru.ro).
According ordinance 20/1994 all buildings inspected must be assigned one of the four risk classes:![]() Clasa Rs I, high risk of collapse, government pay retrofit if owners agree;
Clasa Rs I, high risk of collapse, government pay retrofit if owners agree;![]() Clasa Rs II, structural damage, but little risk of collapse, owners must pay retrofit;
Clasa Rs II, structural damage, but little risk of collapse, owners must pay retrofit;![]() Clasa Rs III, non-structural damage, retrofit not required;
Clasa Rs III, non-structural damage, retrofit not required;![]() Clasa Rs IV, correspond with today earthquake codes.
Clasa Rs IV, correspond with today earthquake codes.
![]() seismic retrofit completed.
seismic retrofit completed.
Read more: https://www.hartablocuri.ro/clase-risc-seismic/
Read more: https://www.hartablocuri.ro/riscul-seismic/
Earthquake engineering history
South and North-East Romania is under risk of Vrancea earthquake zone, which generate deadly 7+ degree earthquakes every 30-50 years.
amccrs-pmb.ro display list of over 2600 buildings from Bucharest inspected and assigned various earthquake risk class, of which about 350 are from communism times and the rest are pre-war buildings (only 4% of communist apartment blocks in Bucharest, and 0-10% in other cities were inspected).
Be careful with apartments advertised as „without earthquake risk,” buildins not appearing on AMCCRS list are not yet inspected thus don’t have a risk class assigned, this does NOT mean that they are safe. Is better to buy an apartment in a Rs3 or Rs4 building than in one with no earthquake risk not yet inspected, with visible cracks, because when it will be inspected it have all chances to enter in Class 1 or 2 and property value will drop with 20-30% because buyers cannot get mortgage.
Before 1963 buildings were designed to withstand gravity forces only. First earthquake safety codes in Romania appeared in 1963, so buildings completed in 1964-1978 are generally safe especially <5 floors ones.
Earthquake engineering codes were revised in 1978 after great earthquake, so buildings completed since 1978 are theoretically even safer, but austerity measures made by Nicolae Ceaușescu increased theft of construction materials, and number of building with flaws increased towards late 1980s.
Earthquake engineering codes were further improved in 1996, 2006, 2013 (source: revistaconstructiilor.eu and Cod proiectare seismica.pdf page 62), but they are often broken by developers using cheapest possible construction materials to increase their profits.
1977 earthquake (7.2 degrees) caused collapse of 33 buildings in Bucharest, of which 3 communist buildings. Official reports showed 1578 deaths of which 1424 in Bucharest.
If an earthquake of same magnitude will hit Romania today, the death tool may be around 5,000-10,000, or even higher if the earthquake is a bit stronger and the number of causalities exceed number of rescuers, and weather is cold, people trapped alive under collapsed buildings will die of cold before they can be rescued.
How I estimate building years
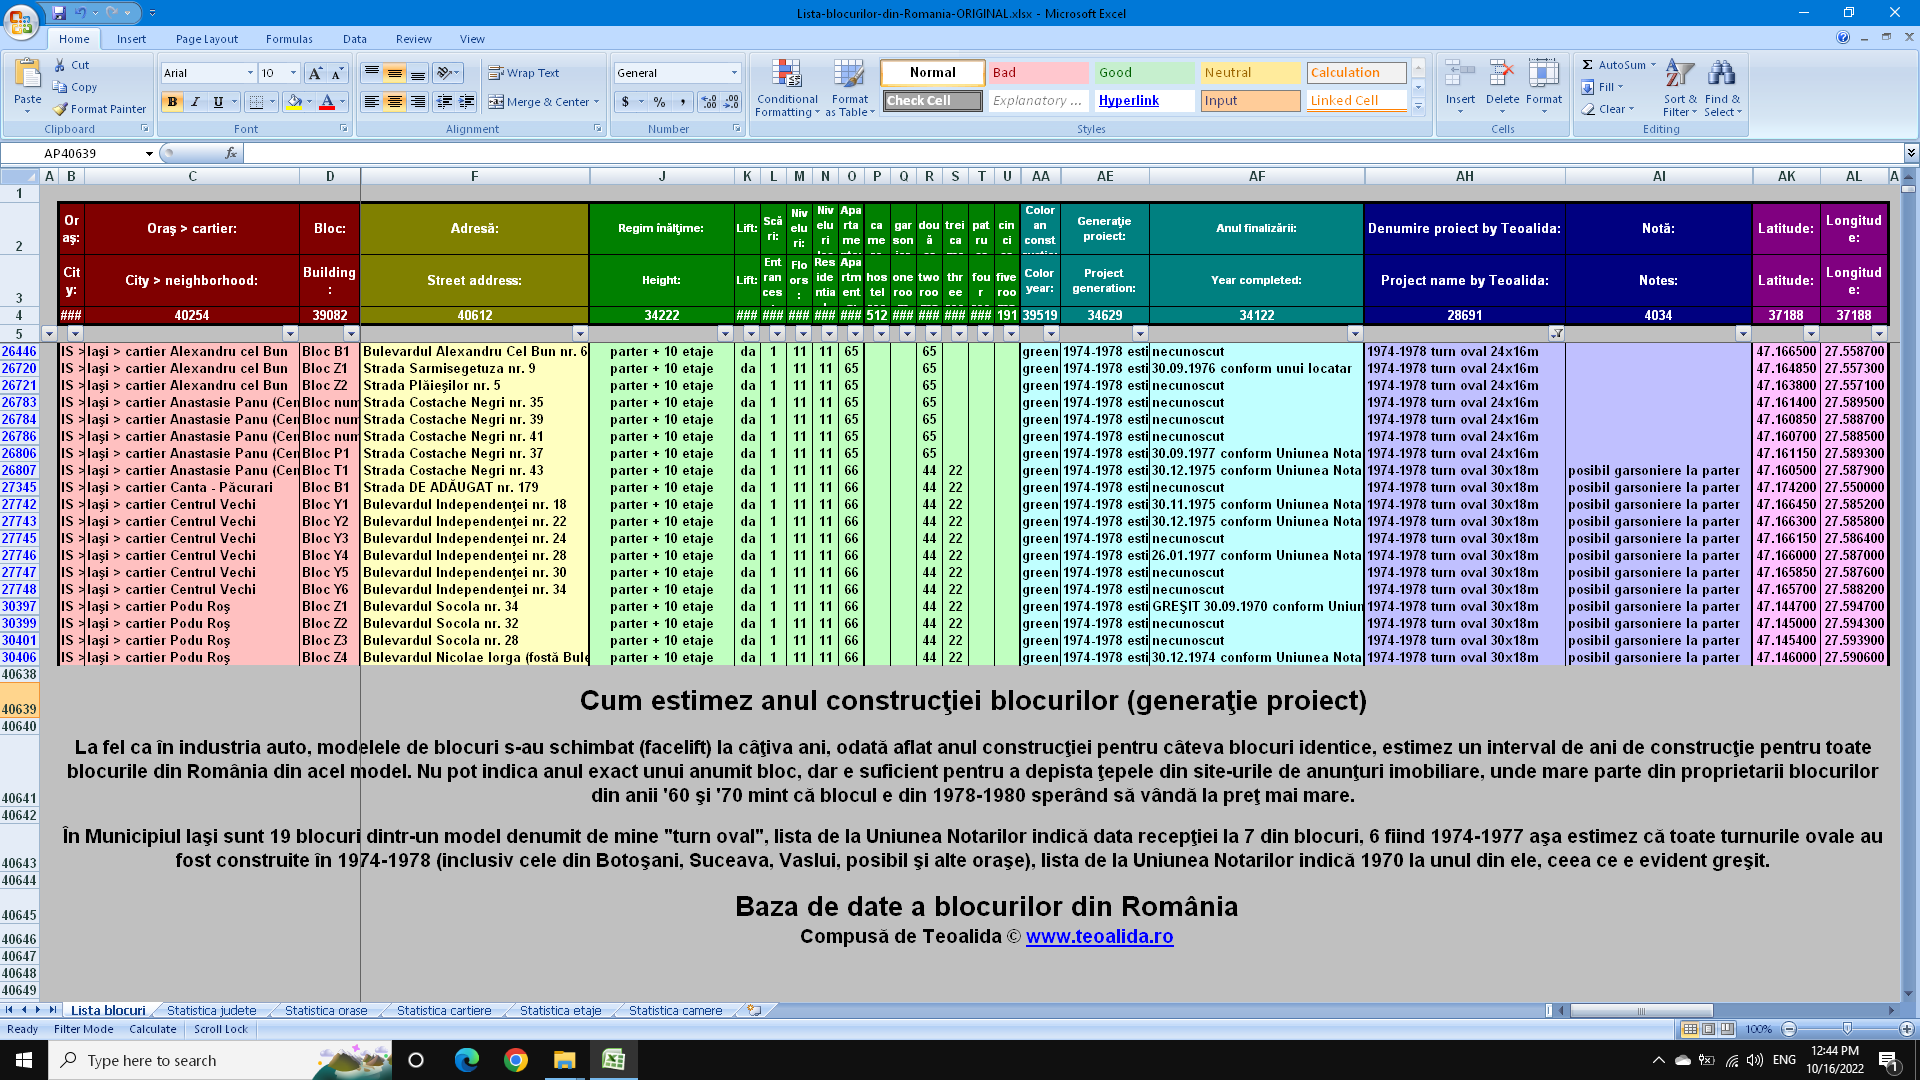
Like car models facelifted and replaced every few years, the communist government of Romania also launched new apartment block models every few years, once I know construction year of few blocks I can assume that all identical blocks are built nearly same time.
When I started this project for Ploiesti city in 2018 I assigned a 10-year range for each block model. On-going research, including database expansion to Bucharest in 2020 and other cities in the following years, helped me to reduce ranges to 4-6 years for most block models.
So, I cannot tell construction year precisely, but is better than nothing, it help you to know at which neighborhoods to look at if you want to buy an apartment built in certain years, and avoid scams (on olx.ro half of apartments listed as 1977-2000 are actually older than 1977).
How you can(not) find building year
Government authorities do not have a centralized database of buildings with their construction year. I personally contacted city hall and ANCPI, receiving negative responses.
Easiest way: ask residents, especially old aged ones and you may find someone living there since building was built, to tell you construction year from his memory. Verbal process given to first owner at the time of construction does indicate construction year, but most people don’t have this paper in hand.
City hall websites does show partial lists with buildings inspected for earthquake risk or included in thermal rehabilitation program, and they are not always correct. I included data from these list into my map and sometimes residents of these buildings told me that data is wrong.
When someone sell apartment, energy auditor write year as told by seller mouth without knowing how correct it is. I received an energy performance certificate stating 1978 from someone requesting me „to correct building year” of a building visible in 1966 aerial photo.
Tax authority does have a database of buildings with construction years but it is a mess, up to 20 years error margin.
History „making of” HartaBlocuri.ro
This project started from my personal interest of studying architecture, specifically mass-built public housing in Romania and Singapore) and pleasure of data analysis (comparing various cities in terms of number of apartments, per block model, per room type, etc).
In 2005-2008 I created simplified tables for several cities of Romania, 1 row per block model, indicating number of blocks built,multiplied by number of apartments per block. The table did NOT including building numbers or street addresses and its only scope was to estimate number of blocks and apartments in each neighborhood then make a total by city, the number of apartments had an error margin of 2%.
Got inspired from Singapore…
In 2009 I lost interest for Romania and I stated a similar project for Singapore, a city with 80% population living in public housing built by HDB (Housing & Development Board). I combined data from multiple government websites into an Excel database with 1 row per block. Since 2015 I sold database to various companies from Singapore and overseas, earning few thousands $.
Singapore launched HDB Map Services in 2011, interactive map to click buildings and see info, I wanted to do the same but I didn’t knew how, until 2017 when a real estate agent from Singapore contacted me and I saw on his website an interactive map of HDB blocks colored accorging year built. He told me that made it using Google Fusion Tables, a free experimental service launched in 2009. I improved my HDB Database with GPS coordinates and floor plans, and imported data in Fusion Tables, the Map of HDB blocks increased popularity of my website www.teoalida.com.
Fusion Tables s-a închis în 2019, înlocuit cu Google My Maps (gratuit dar limitat la 2000 pin-uri), așa că am trecut la ZeeMaps ($19,95/lună, fără limită de pin-uri), pe care l-am folosit 3 ani, până în decembrie 2022 când am trecut la WP Go Maps (plugin WordPress $40/nelimitat), astfel toate datele sunt stocate pe site-ul meu și nu pe un server extern, ceea ce îmi dă libertate de configurare.
…to make first ever database of buildings in Romania
In January 2018 I decided to start a database with 1 row per block for my city Ploiești. Since Romania government does not offer complete databases of buildings, I had to research myself and enter all data by hand.
For one year and half, the database contained ONLY communist blocks from Ploiești, including street name, block number, number of floors, apartments, estimated construction year and GPS coordinates. In mid-2019 I added recent built condos and earthquake risk class (visitors requested this) and breakdown by room type (my own idea) and started expanding database to small cities from Prahova county and Târgoviște city in January 2020.
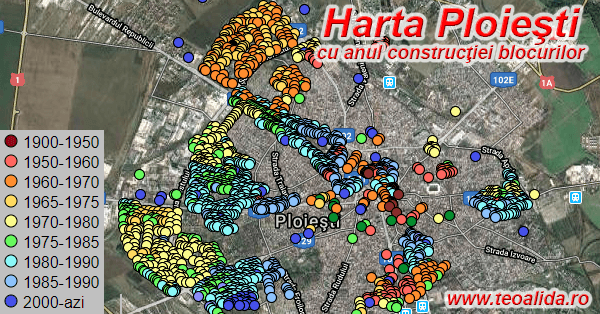
I realized that most people are interested (only) in construction year, so in February 2020 I used Google Earth to draw polygons coloring each neighborhood according construction year estimated from satellite photo (without using any official list of construction year). The job took 1-2 hours per city, provisional maps until I have enough time to add each individual building in database.
In March 2020 I posted on various Facebook groups and Reddit, hoping to find experts with access to real data, willing to collaborate with me to develop this project further. While few people conggratulated me for initiative, I got numerous negative comments from experts regarding lack of accuracy of colored polygons (like when this map is a book that once published cannot be modified).
Instead of telling me real construction years where I did wrong so I can correct them, they told me that map is useless, fake information, and I shouldn’t have started such project unless I have real data (from where?). I was so depressed thus I abandoned project for 3-4 months.
Meantime, among people coming to my website from Google, impressed by details available in Ploiești map, they requested me to do the same for București. Few people informed me about possible sources of data, example fostulbucuresti.github.io which contains aerial photos from 1927 to 1982 and PDF lists with blocks selected for thermal rehabilitation program (including construction year), but nobody gave me a helping hand in compiling data, so I had to research and enter all data in Excel MYSELF, over 400 hours of work that stretched between July and December 2020. Additional work done in 2021 to improve accuracy.
After completing București map, many news websites mentioned my website www.teoalida.ro and traffic jumped to 1000 visitors/day, of which 90% came for building information and less for knowing author and my other projects, consequently in February 2022 I bought a dedicated domain for this project: hartablocuri.ro.
Thanks to:
Ionuț, who made a database with 1 million addresses (he extracted them from mapdata.ro in 2014 for a personal project which abandoned after a baby was born), he gave me his data in December 2021 and it help me saving 10-20% of time since I already have block numbers and GPS coordinates and I only need to add rest of details (this make project feasible also for cities where OpenStreetMap don’t have block numbers).
Luca, a student who started adding building details for Constanța city in 2021, but gave up after doing 15% of city, he also contributed with 100 apartment plans collected from real estate websites.
Future of this project
During 2021 I added building details for Buzău, Iași, Hunedoara, and the database reached 26,000 buildings.
During September-December 2021 I sent marketing emails to 30 companies in real estate, home insurance and telecommunication, presenting the story of my project and asking if they can use my database or ideas how to make it more useful. The ONLY replies were “we forwarded your email to department X and if we are interested we will contact you”. The lack of feedback made me to NOT rush expanding project to any further cities, and focus only on updates in cities already done.
Expanding project to whole Romania is very time consuming compared with benefits. During 2022 I expanded to only 1 county: Constanța, and during 2023 to Brașov, Galați, Pitești, reaching 40,000 buildings. I keep adding in București ~10 new launched condos each month.
Each year, thousands people contribute by reporting errors or offering additional data. This project started consuming too much of my life, reading messages and editing database, without a market research, to ensure that I add data that people need, and I don’t waste time adding data that nobody needs.
Romania have an estimated number of 90,000 apartment blocks and I cannot research and manage all them ALONE. Will take at least 10 years, what if next year I will get married and have a baby? I will not be able to continue this project anymore, regardless of how much $ I earn from sales of data.
Bucharest residents use my map often, but in the rest of Romania audience is low, especially in Transylvania where earthquakes do not produce damage, people are not so interested in how old are buildings. Calculating from number of people visiting website, Iași have 1/20, Galați 1/30 while Brașov and Constanța have 1/40 of traffic received by Bucharest, even if population of each of these cities is 1/7 of Bucharest population.
80% people visit website looking for construction years (the ONLY info that I cannot provide accurately and leads to negative comments), I cannot estimate construction years in small cities as precise like I did in Bucharest. The provisional maps with colored polygons (1-2 hours/city) does show estimated construction year per neighborhood, adding individual buildings in database (dozens hours/city) with details like number of floors and apartments plus their floor plans, is not justified when too few people are interested in this info, while year of construction will remain estimated within a range of few years like on the provisional map.


